

Free AI Video Upscaler Test: SeedVR2 at 1080p, 2K and 4K
SeedVR2 is a free, open-source AI video upscaler. We measured 1080p, 2K and 4K with spectra, thousands of edges and a shrink-back test. 2K adds real detail. 4K mostly adds pixels.
SeedVR2 is an open-source AI video upscaler under Apache 2.0. The model is free, with no watermark and no usage limit. You need a GPU.
Our first reaction to the output was two words: "Not bad."
How not bad? Results first, then we measure.
| Upscale to | Size | Time per second of video | System RAM |
|---|---|---|---|
| 720p | 1248×720 | 11 s | 32 GiB |
| 1080p (1K) | 1890×1080 | 26 s | 62 GiB |
| 1440p (2K) | 2520×1440 | 48 s | 57 GiB (7 s run) |
| 4K | 3780×2160 | 110 s | 59 GiB (3.5 s run) |
Our pick: a 768 source, 7B INT8, upscaled to 1080p, with lab color correction. The rest of this article is why.
How long does it take to upscale to 1080p, 2K and 4K?
Double the pixels, double the time. From 1080p up, 80% of that time goes to the VAE and only 7 to 8% to the model's own sampling, which is why switching precision later barely moves the total.
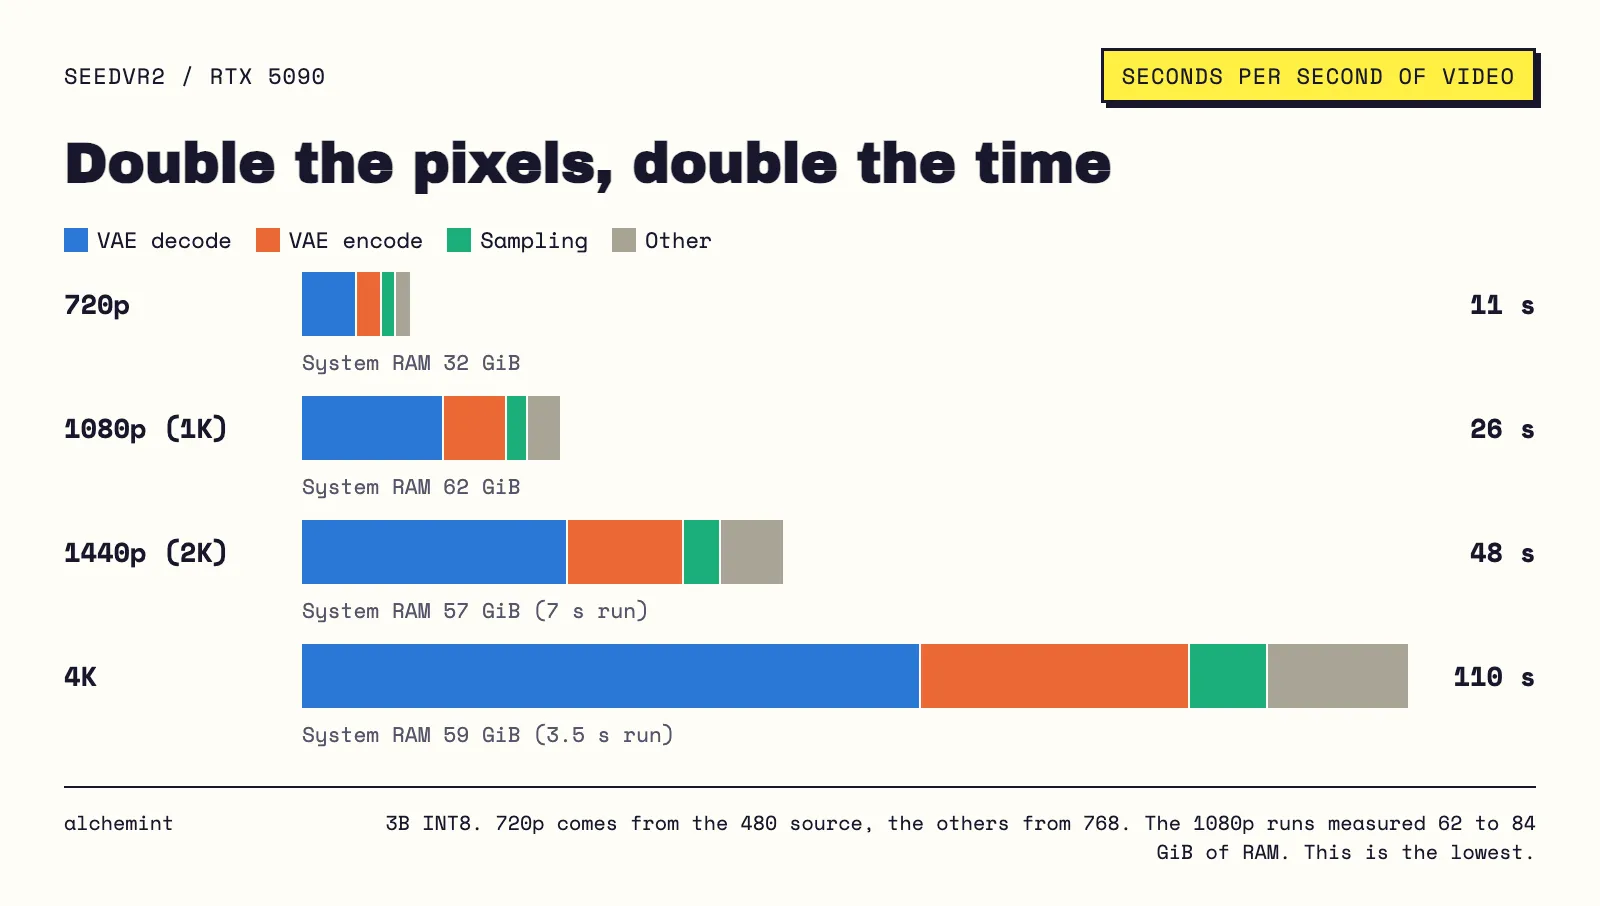
We didn't run 14 seconds at 2K or 4K, only the opening seconds. Scaled up, memory would hit 115 and 235 GiB. Our machine stops at 93 GB, so you'd split the clip, upscale the parts and join them.
At 4K, one second of video takes nearly two minutes. Is the detail you get for that time real?
Does AI upscaling add real detail, or just pixels?
There's a standard way to check: the frequency spectrum.
A 768 source can only hold so much detail. At 1080p that limit sits at 0.356 cycles per pixel, the yellow box below. Plain upscaling (lanczos) stretches the pixels and stays inside the box. Anything outside it wasn't in the source.
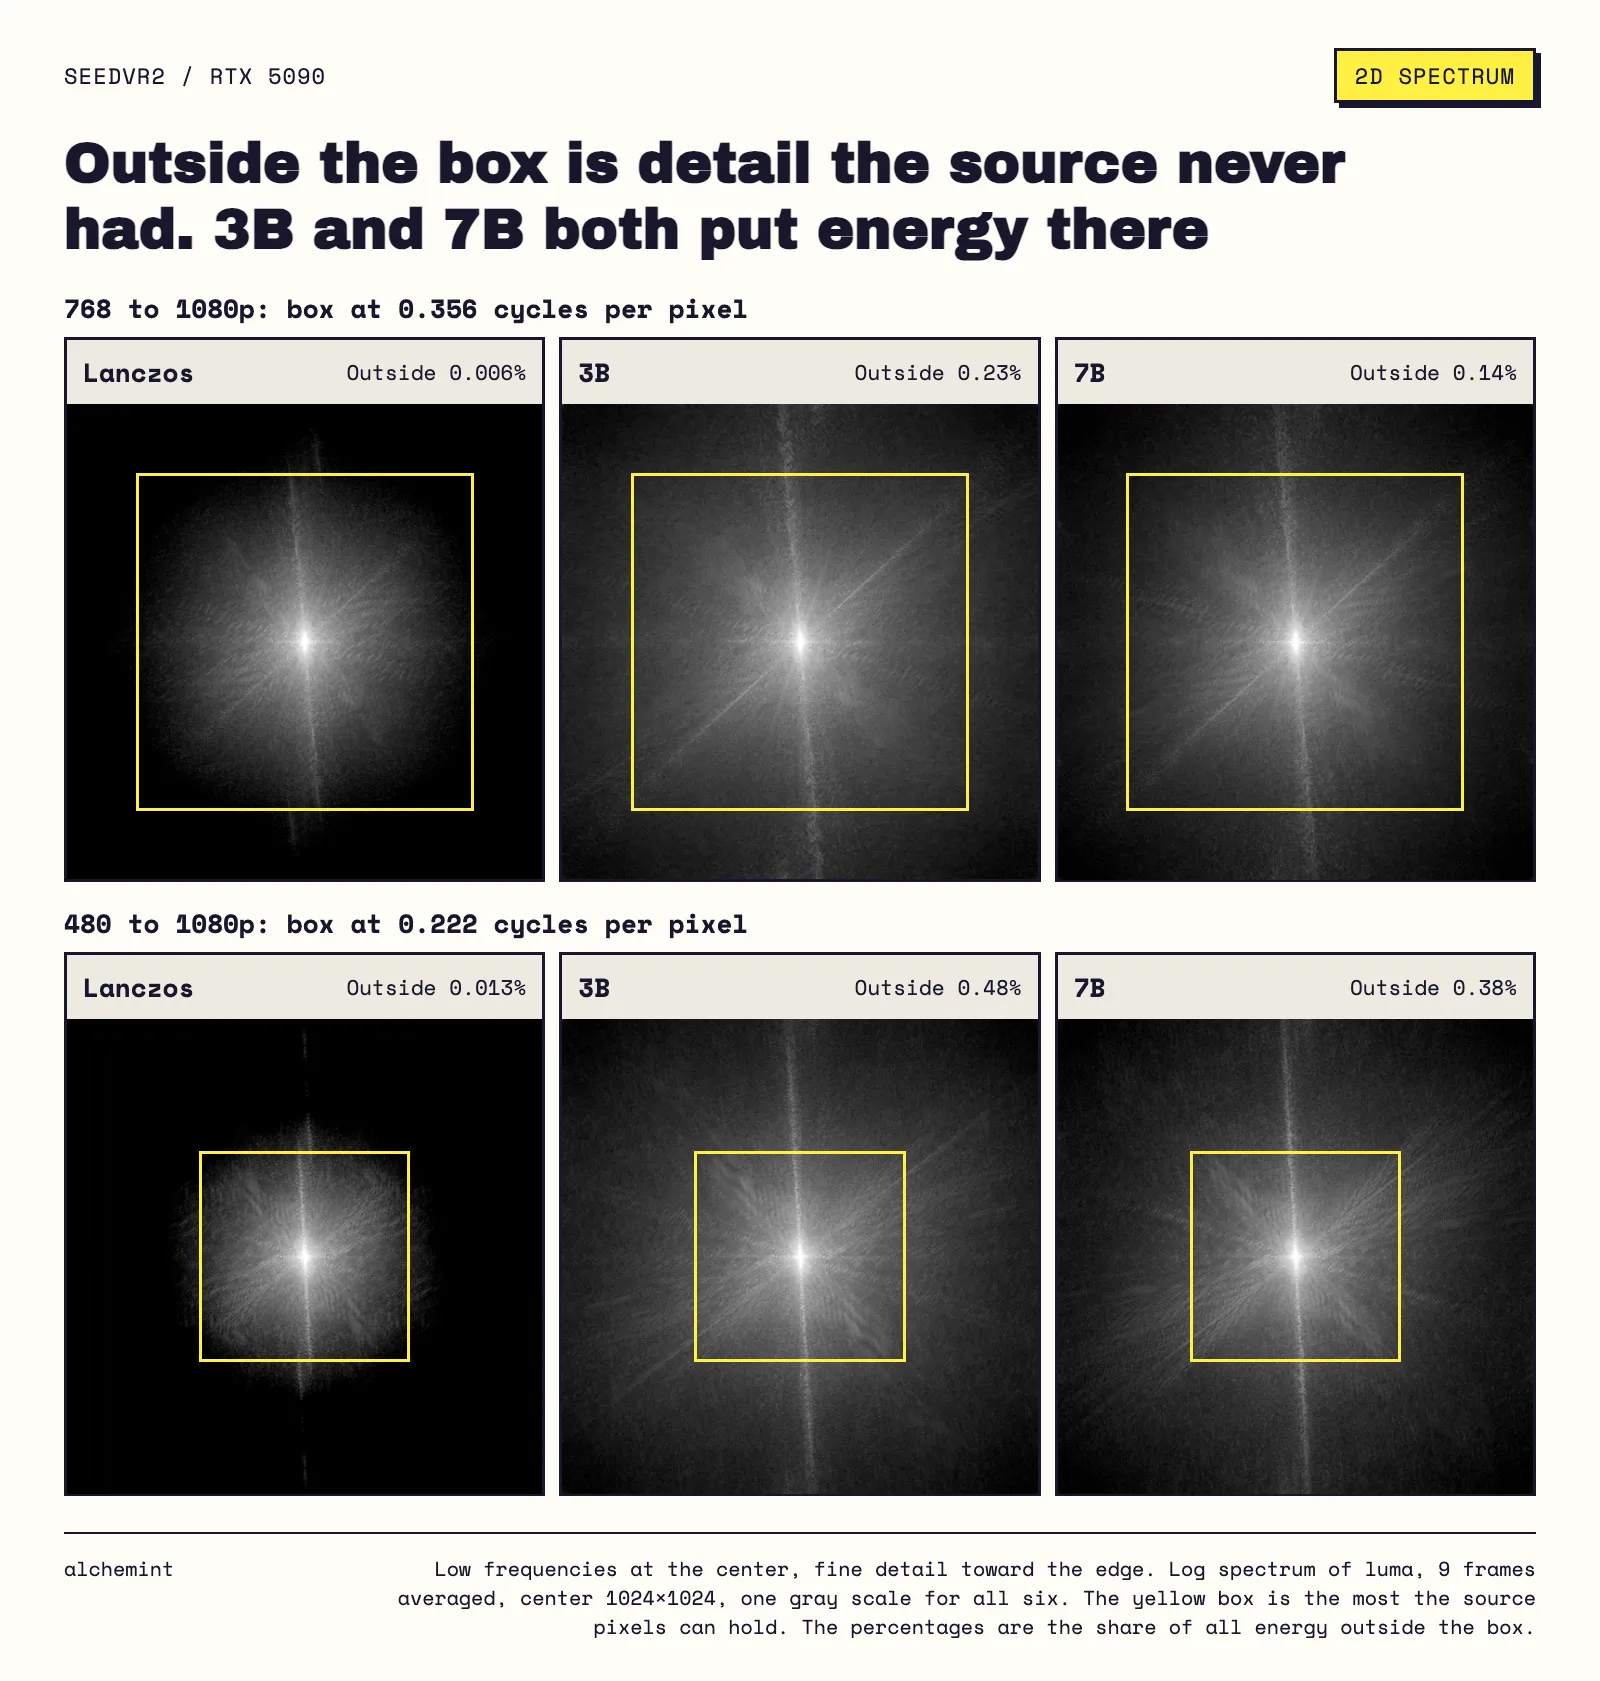
Share of all energy outside the box: lanczos 0.006%, 3B 0.23%, 7B 0.14%. The 480 source has its box at 0.222, and the shares are 0.013%, 0.48% and 0.38%.
Those are small numbers, because nearly all of a picture's energy sits at low frequencies. The gap isn't small: 21 to 37 times.
The curve makes it plainer. Past the dashed line the source falls away. 3B and 7B carry on.
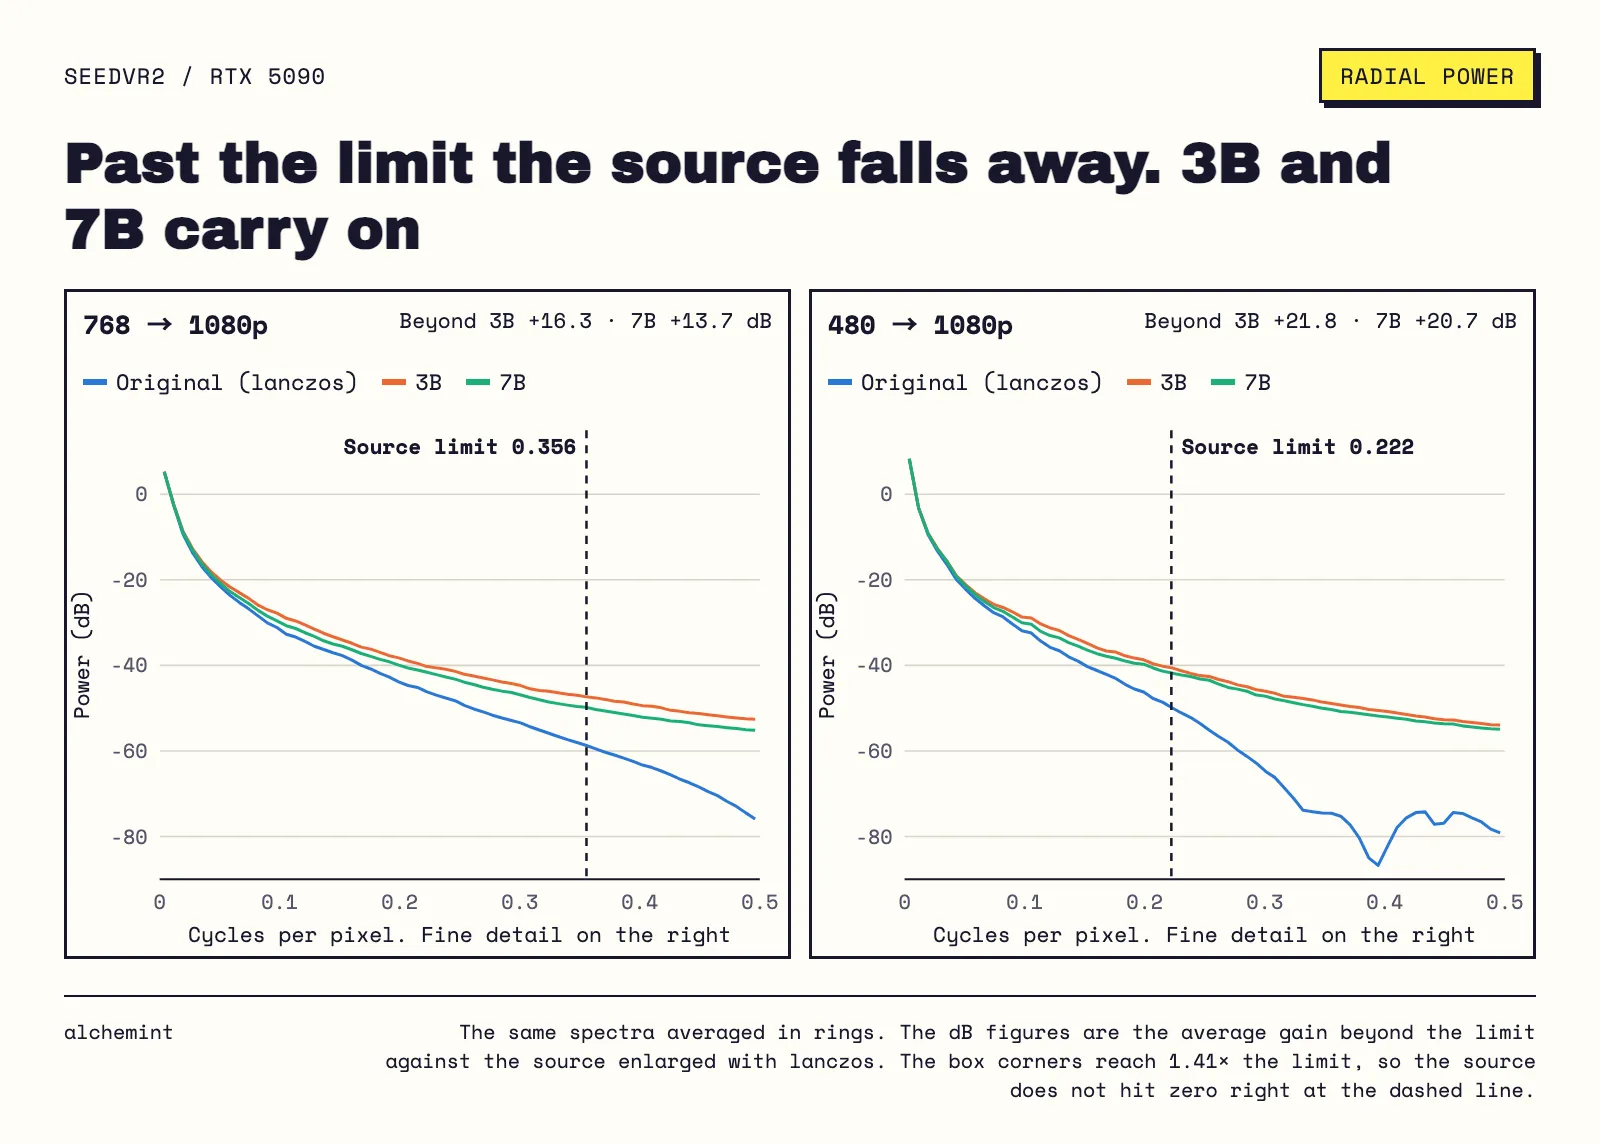
Beyond the limit, that's 14 to 16 dB higher on the 768 source and 21 to 22 dB on the 480. The softer the source, the more the model adds.
So yes, it's real. It also didn't come from the source. The model made it. Making 1080p detail doesn't mean it can make 4K detail.
Are 2K and 4K worth upscaling to?
Put 1080p, 2K and 4K on one axis: the same first 3.5 seconds, the same area of the picture, frequency in cycles per picture height.
Then pick a ruler. Effective lines are twice the highest frequency still above −57 dB. That's the level the 768 source has at its own limit, so the source measures exactly 768 lines.
1080p measures 1080: it runs out of pixels before it runs out of detail. 2K measures 1424 out of 1440. 4K measures 1329.
A 2160-line picture with 1329 lines of detail. Fewer than 2K.
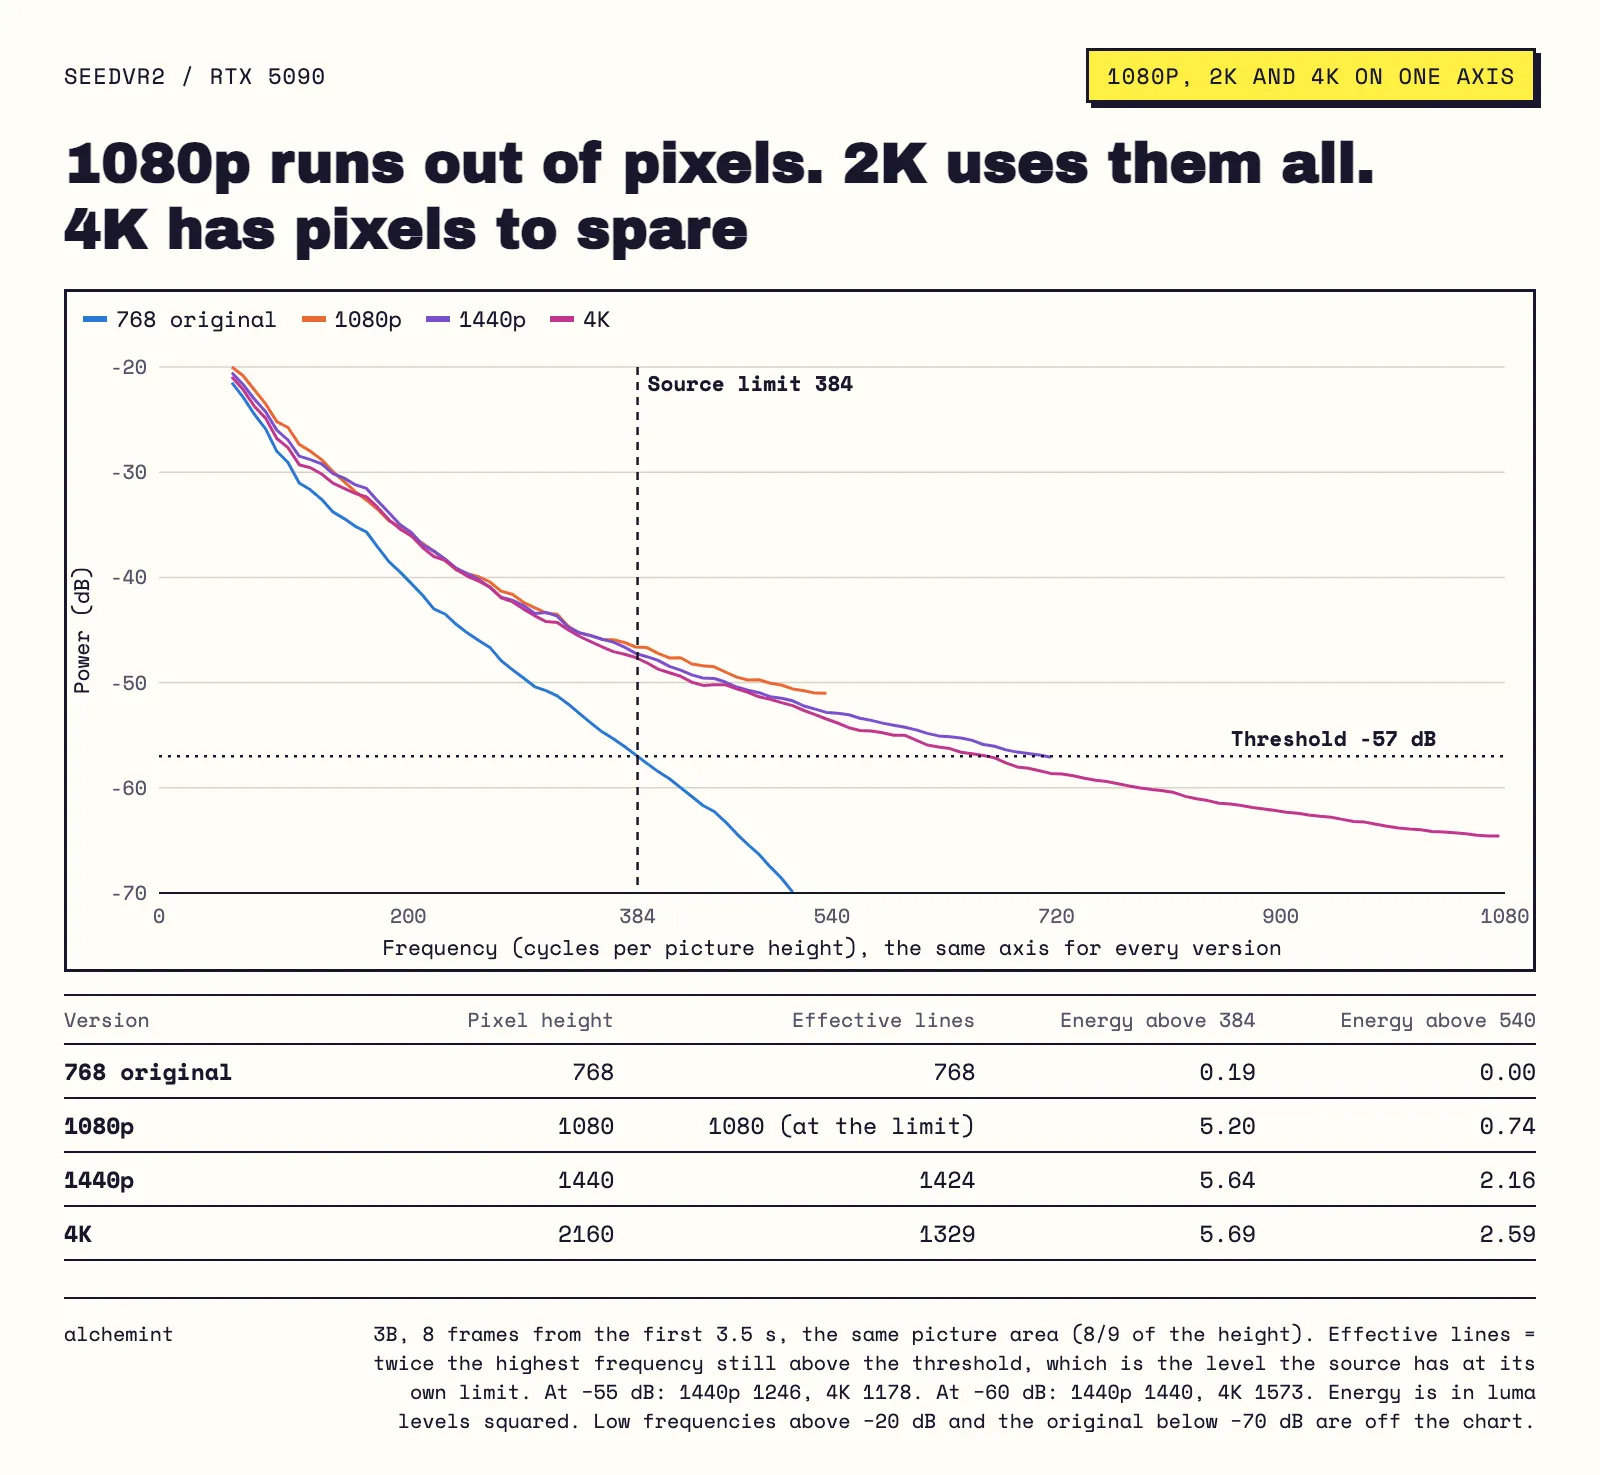
Loosen the threshold to −60 dB and 4K reaches 1573, still nowhere near 2160. The totals agree. Energy above the source limit is 5.20 at 1080p, 5.64 at 2K and 5.69 at 4K, so going from 2K to 4K adds 1%. The model isn't making more detail at 4K. It's spreading about the same amount higher up.
2K is different. Above 540 cycles, where 1080p runs out of room, 2K has nearly three times the energy. That part is new.
Your eyes say the same. 2K adds a little hair. In this frame the 4K ear edge also picks up a red fringe.
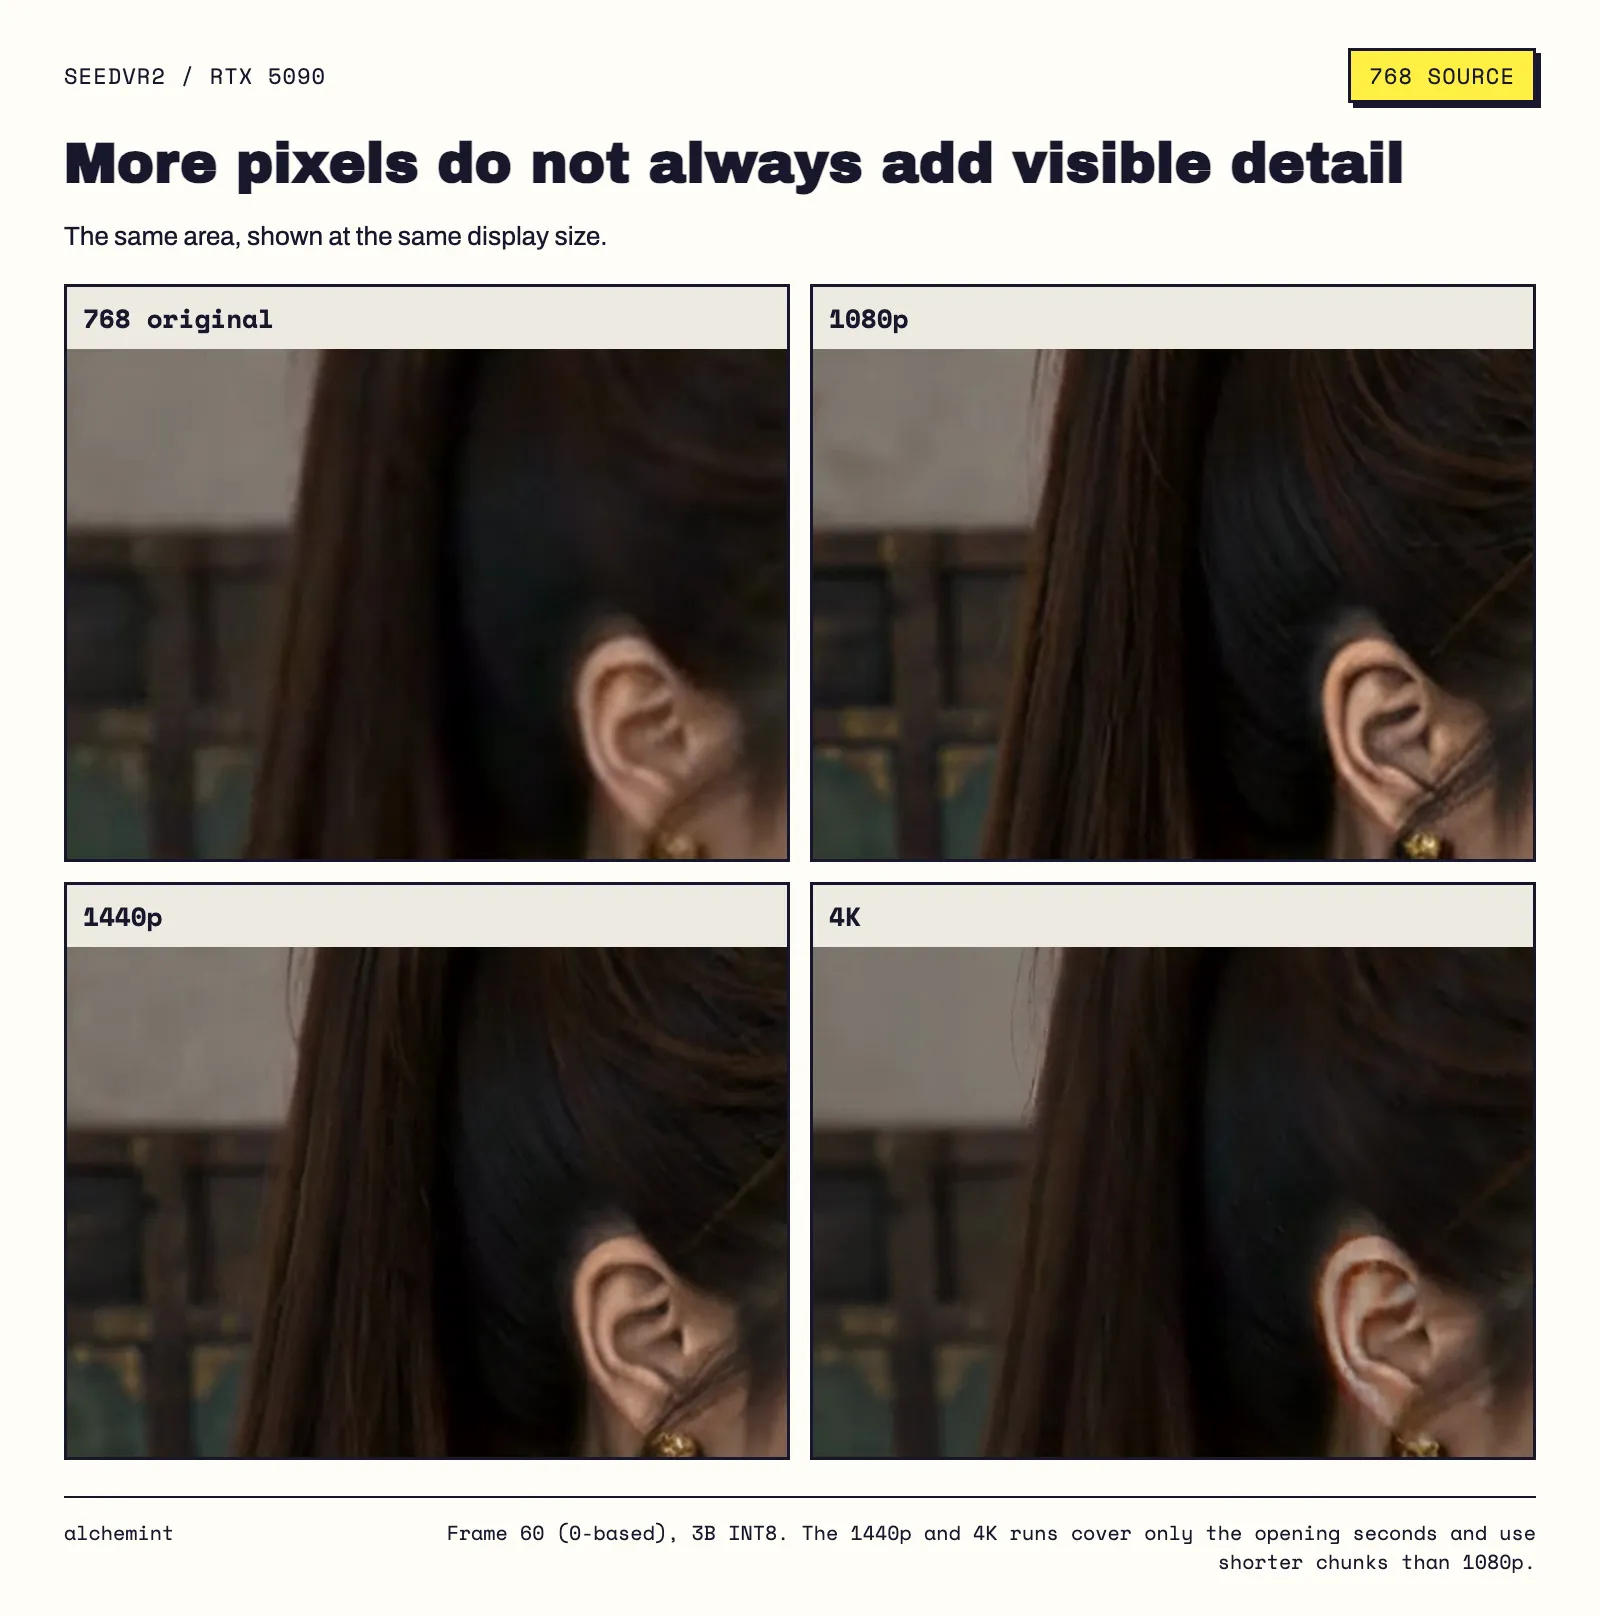
4K takes four times as long as 1080p, while 2K takes under twice as long. Stop at 1080p if it's enough, and go to 2K if you want more. We wouldn't run 4K.
More detail should mean a sharper picture. We got this one wrong the first time.
Does upscaling sharpen edges? Is there a halo?
We started by measuring one edge, on an eyelid. It came out 3× steeper.
Then we measured 9,258. Nine frames, strong edges with flat sides in the source, one at a time.
Median 10–90% rise: source 6.6 pixels, 3B 5.9, 7B 6.2. That's 11% and 6% narrower.
The 3× belonged to that one edge.
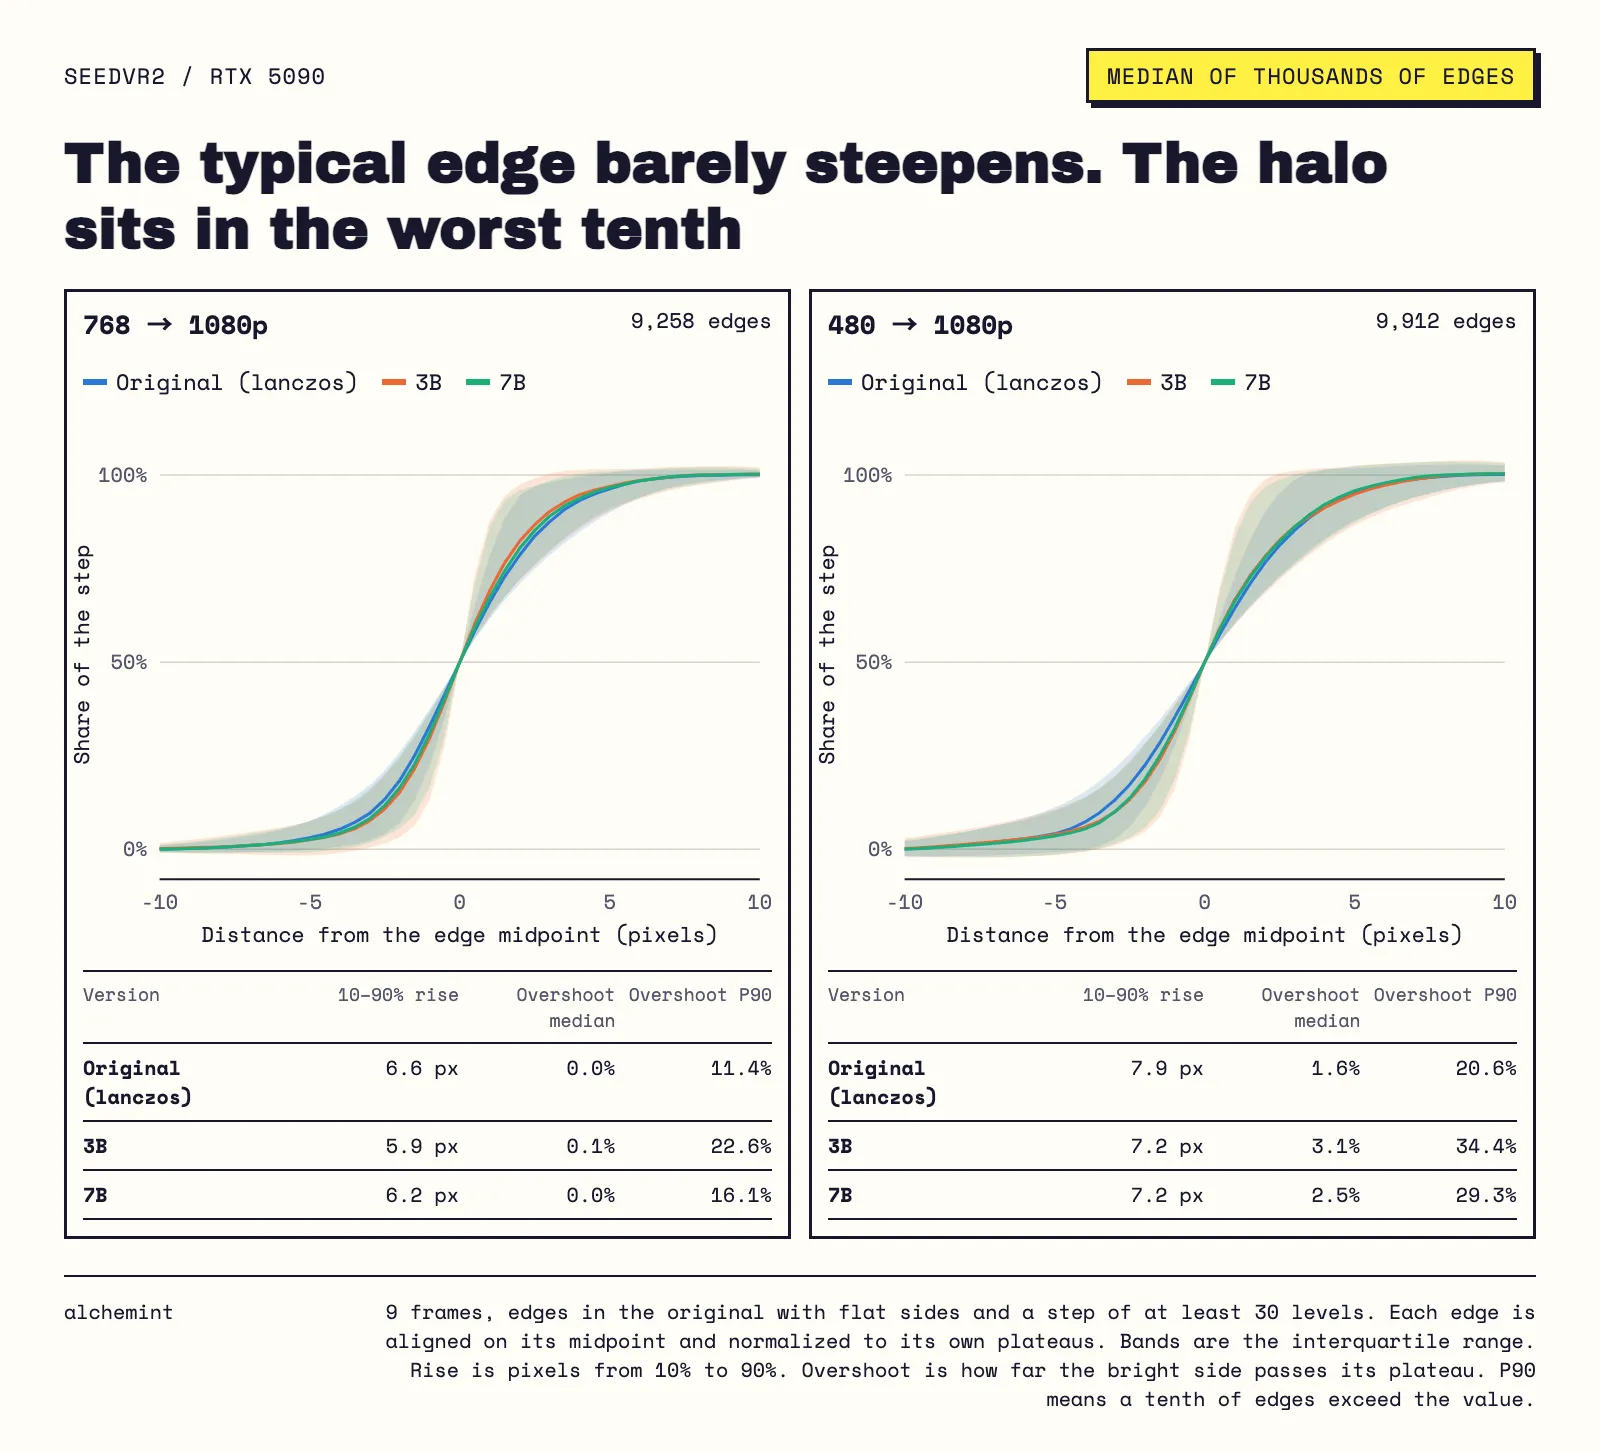
The halo lives in the tail. The median edge has almost no overshoot. The worst tenth does: 11% in the 768 source, 23% with 3B, 16% with 7B, and on 480 it's 21%, 34% and 29%. The source already had some, and on 768, 3B doubles it.
The official model card warns about this: on lightly degraded AI video the model tends to generate too much detail and can oversharpen. AI video is exactly what we tested.
So edges barely move, yet energy outside the box is up dozens of times. Most of it has to be texture. And texture is where a model can get things wrong.
Can you trust the added detail?
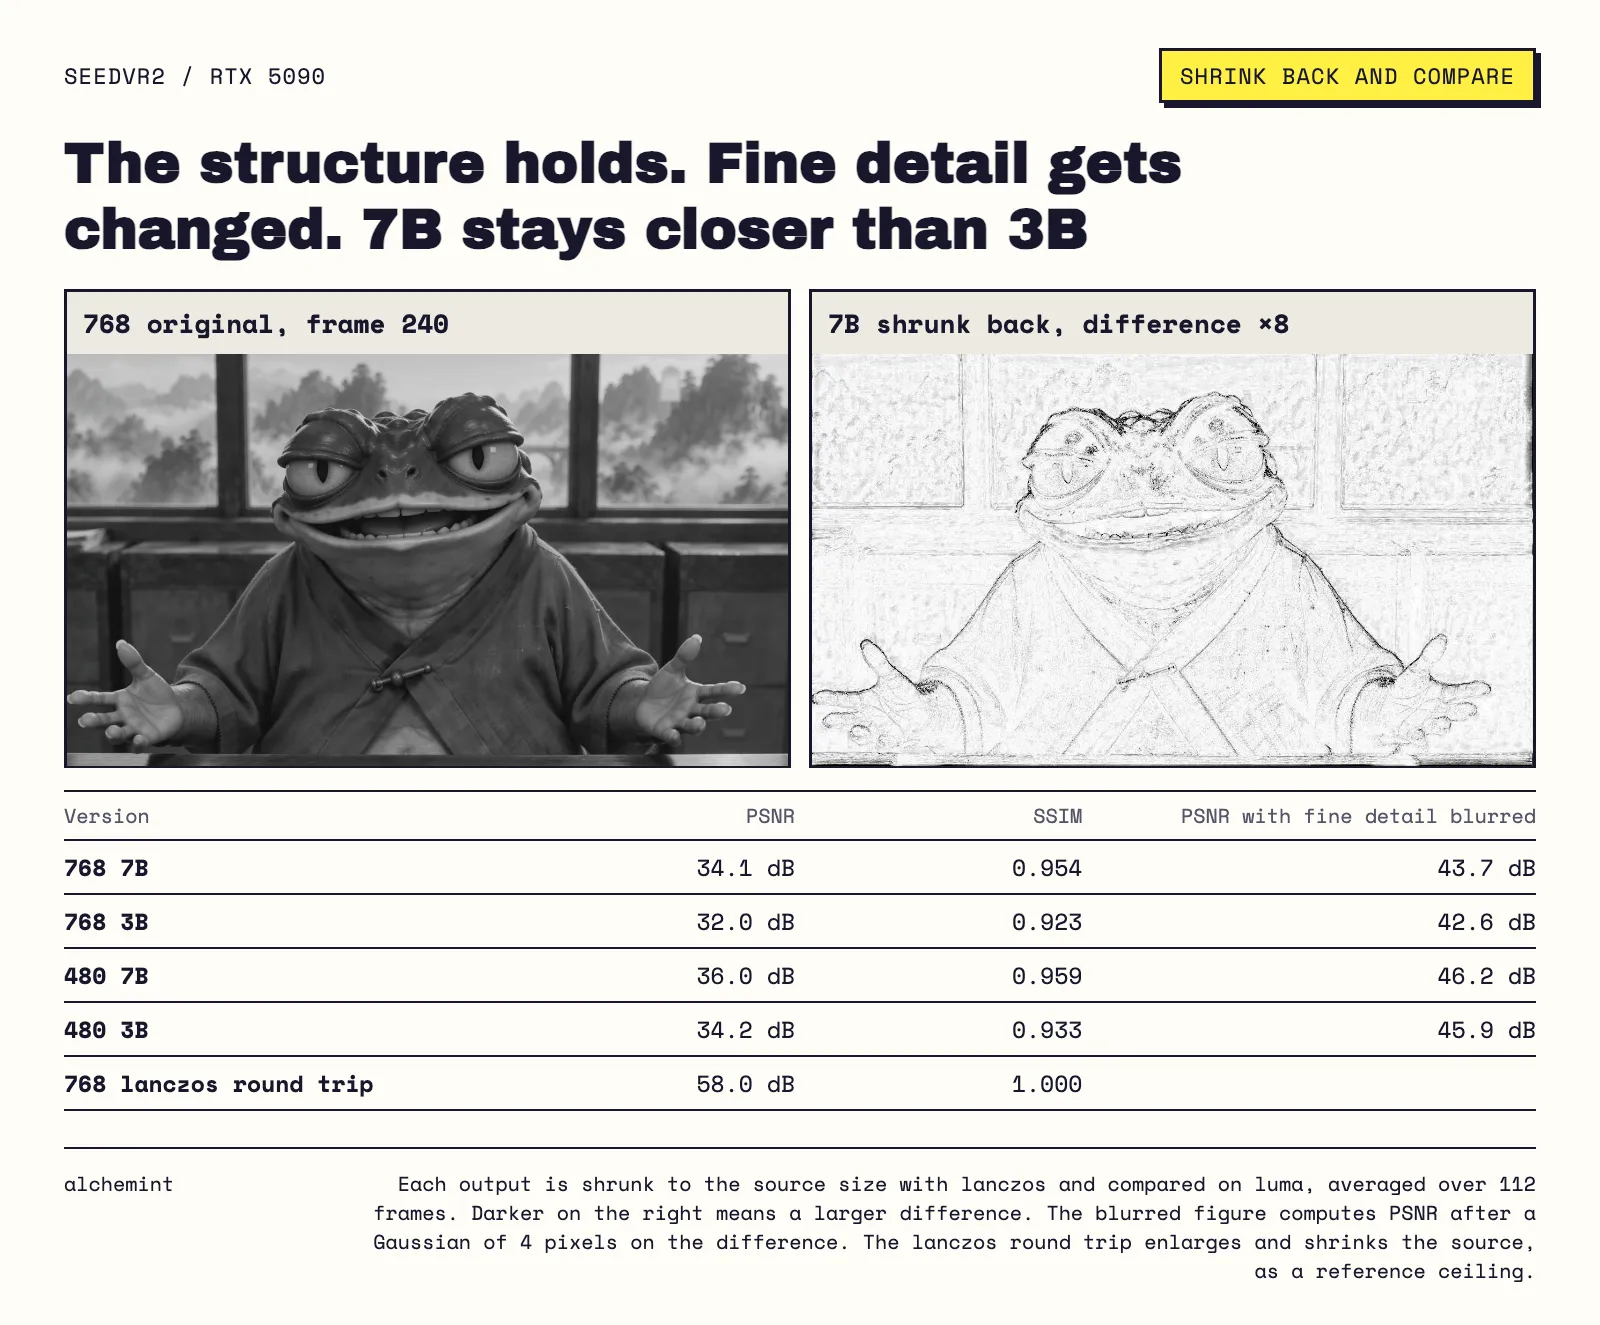
The check is simple. Shrink the output back to source size and compare. If the model only added detail and left the source alone, the two should nearly match.
They don't nearly match. On 768, 7B scores 34.1 dB PSNR and 0.954 SSIM, 3B scores 32.0 dB and 0.923, and plain upscaling shrunk back scores 58 dB. The model changes things inside the box too.
What it changes is fine detail. Blur the difference and the score climbs to 43 to 46 dB. The difference map agrees: edges and texture are dark, flat areas are white. Shapes, clothes and positions stay put. The texture is new.
The same ruler answers the 4K question from the other side. On 3B's first 3.5 seconds, 1080p scores 31.7 dB, 2K 33.6, 4K 35.7. 4K's generated detail sits at higher frequencies, so it vanishes when you shrink it, and what's left looks most like the source.
Two sources, three numbers, and 7B is closer every time. Zoom in and you can see why.
3B or 7B?
3B adds orange-brown scratches to the robe that the source doesn't have. 7B keeps the fabric close to the source.
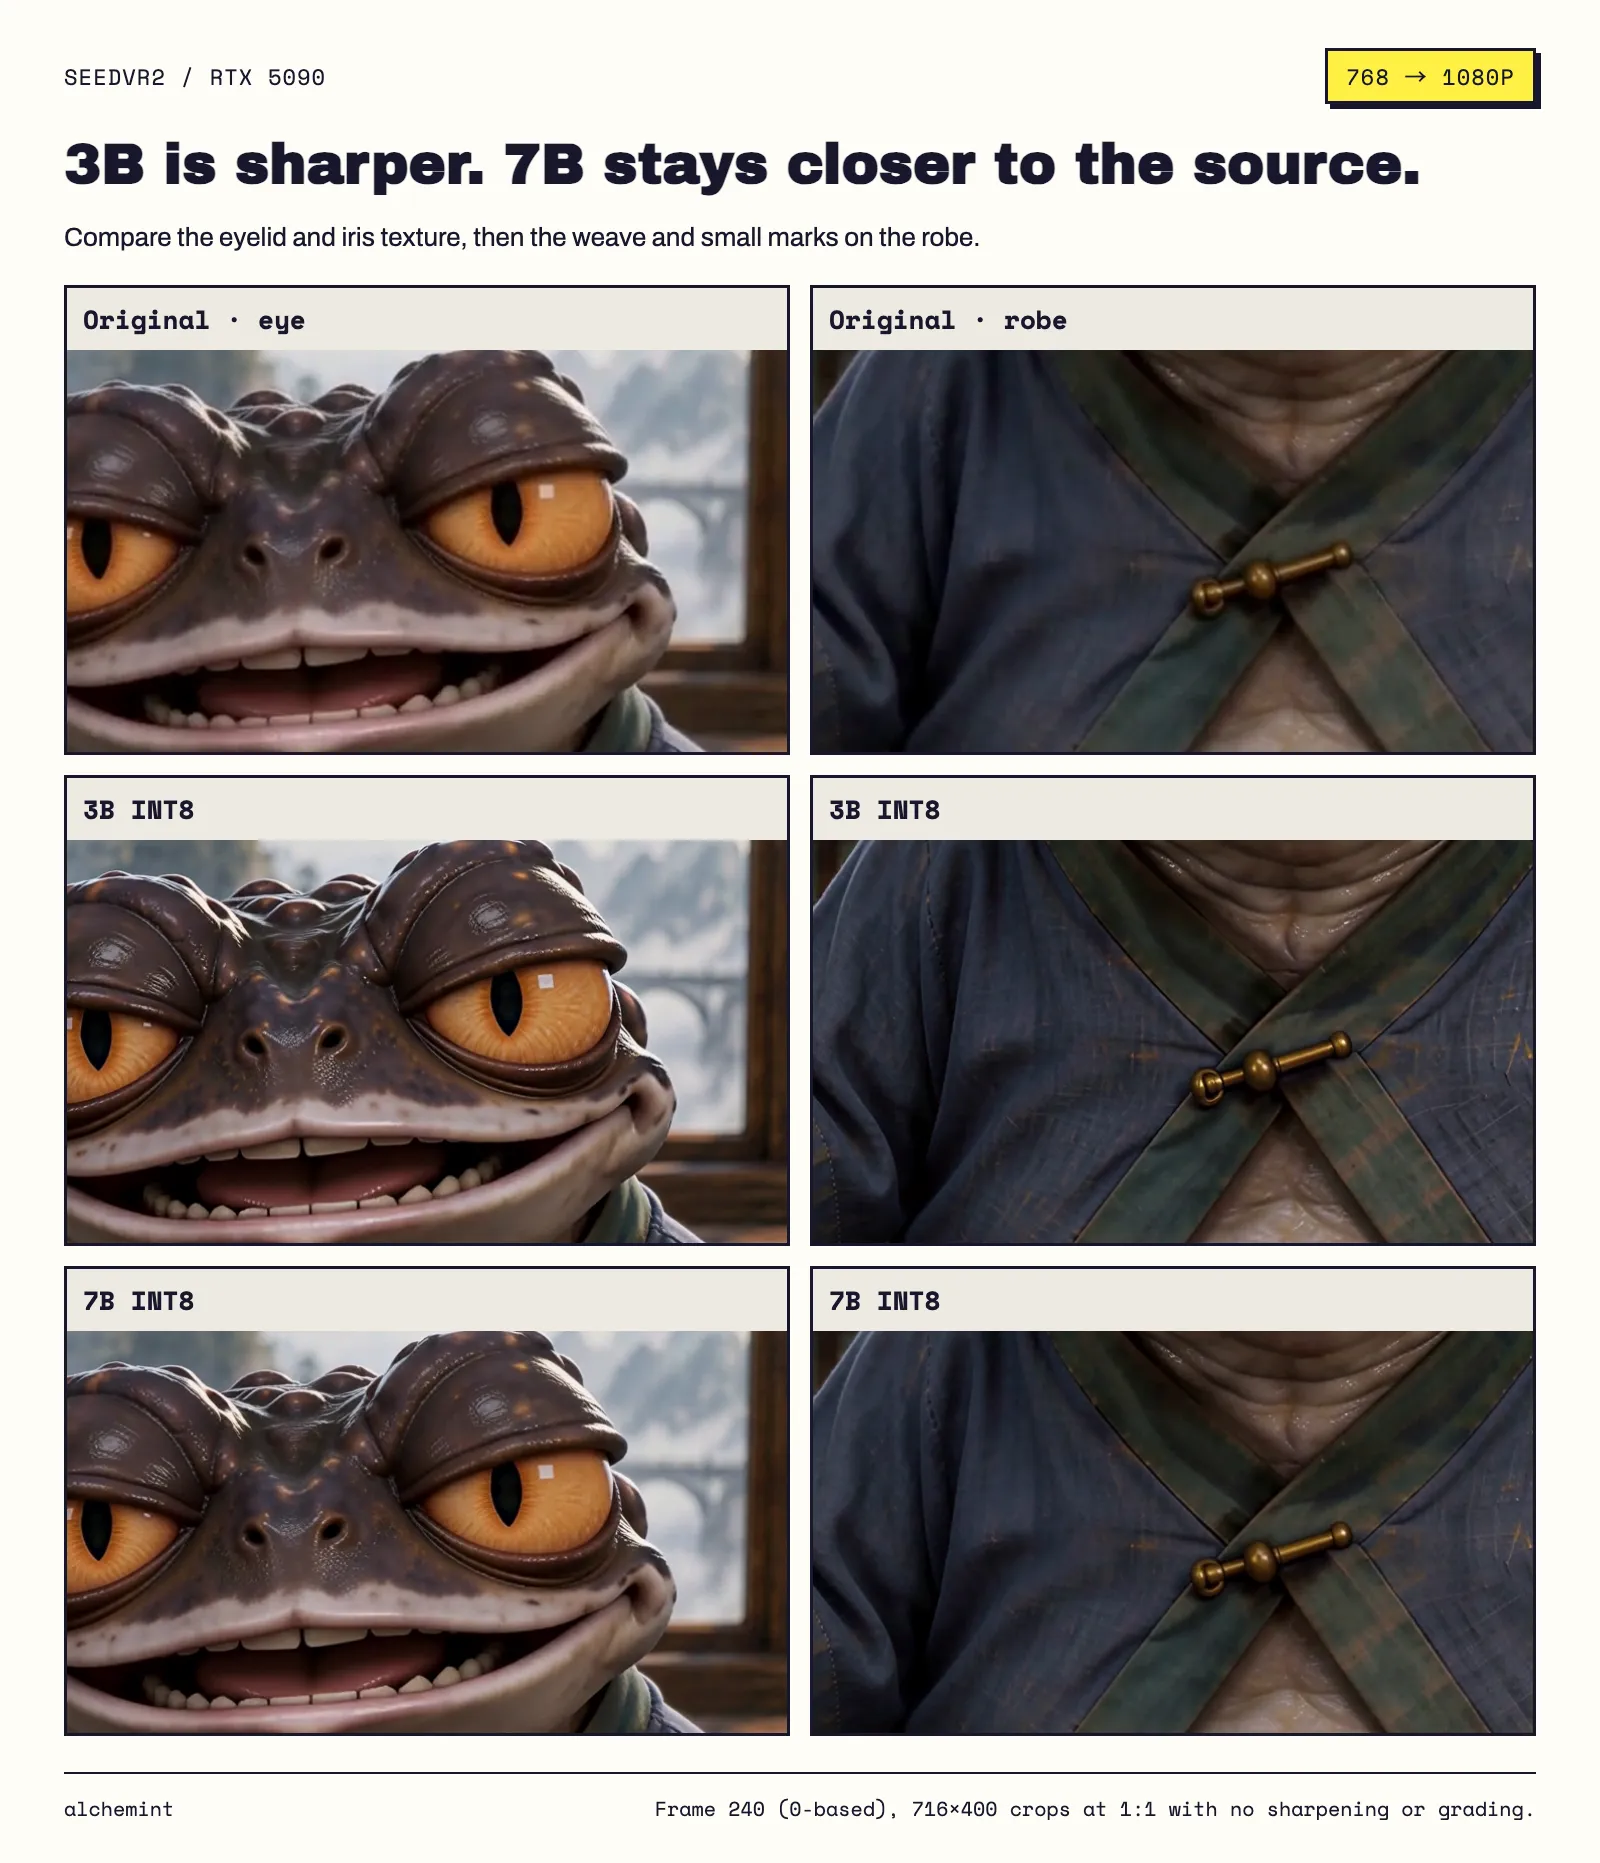
If you want crisp, take 3B and accept that it makes things up. We use 7B.
If the texture is generated, is it spread evenly or piled into some brightness range?
Do shadows and highlights survive?
Every band gains detail, reaching 1.4× to 2.9× the source. In the shadows, 3B reaches 1.7 to 1.9× and 7B 1.4 to 1.6×.
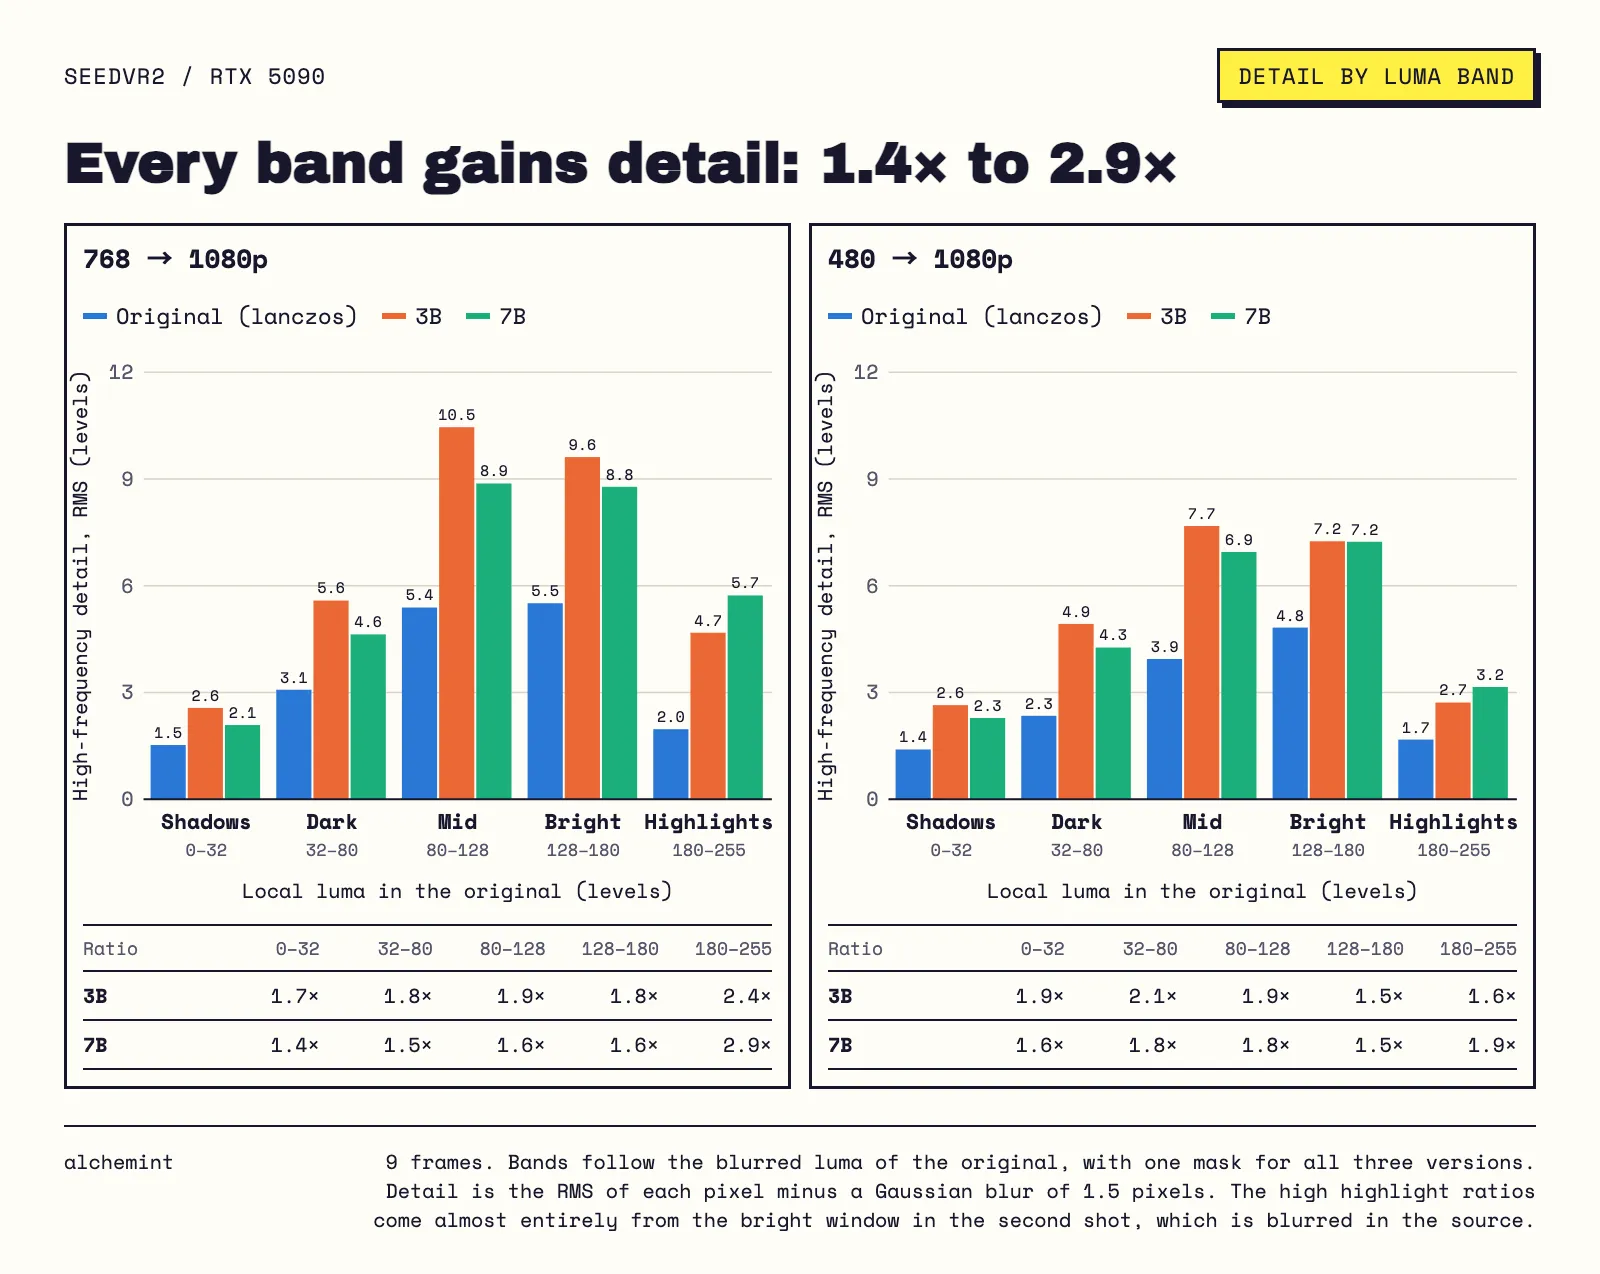
The 2.9× is in the highlights, and there 7B beats 3B. That's one shot, not the whole clip. The window in the second shot is blurred in the source, and the model sharpens it. In shots one and three, 3B still adds more. If you want that background soft, check this yourself.
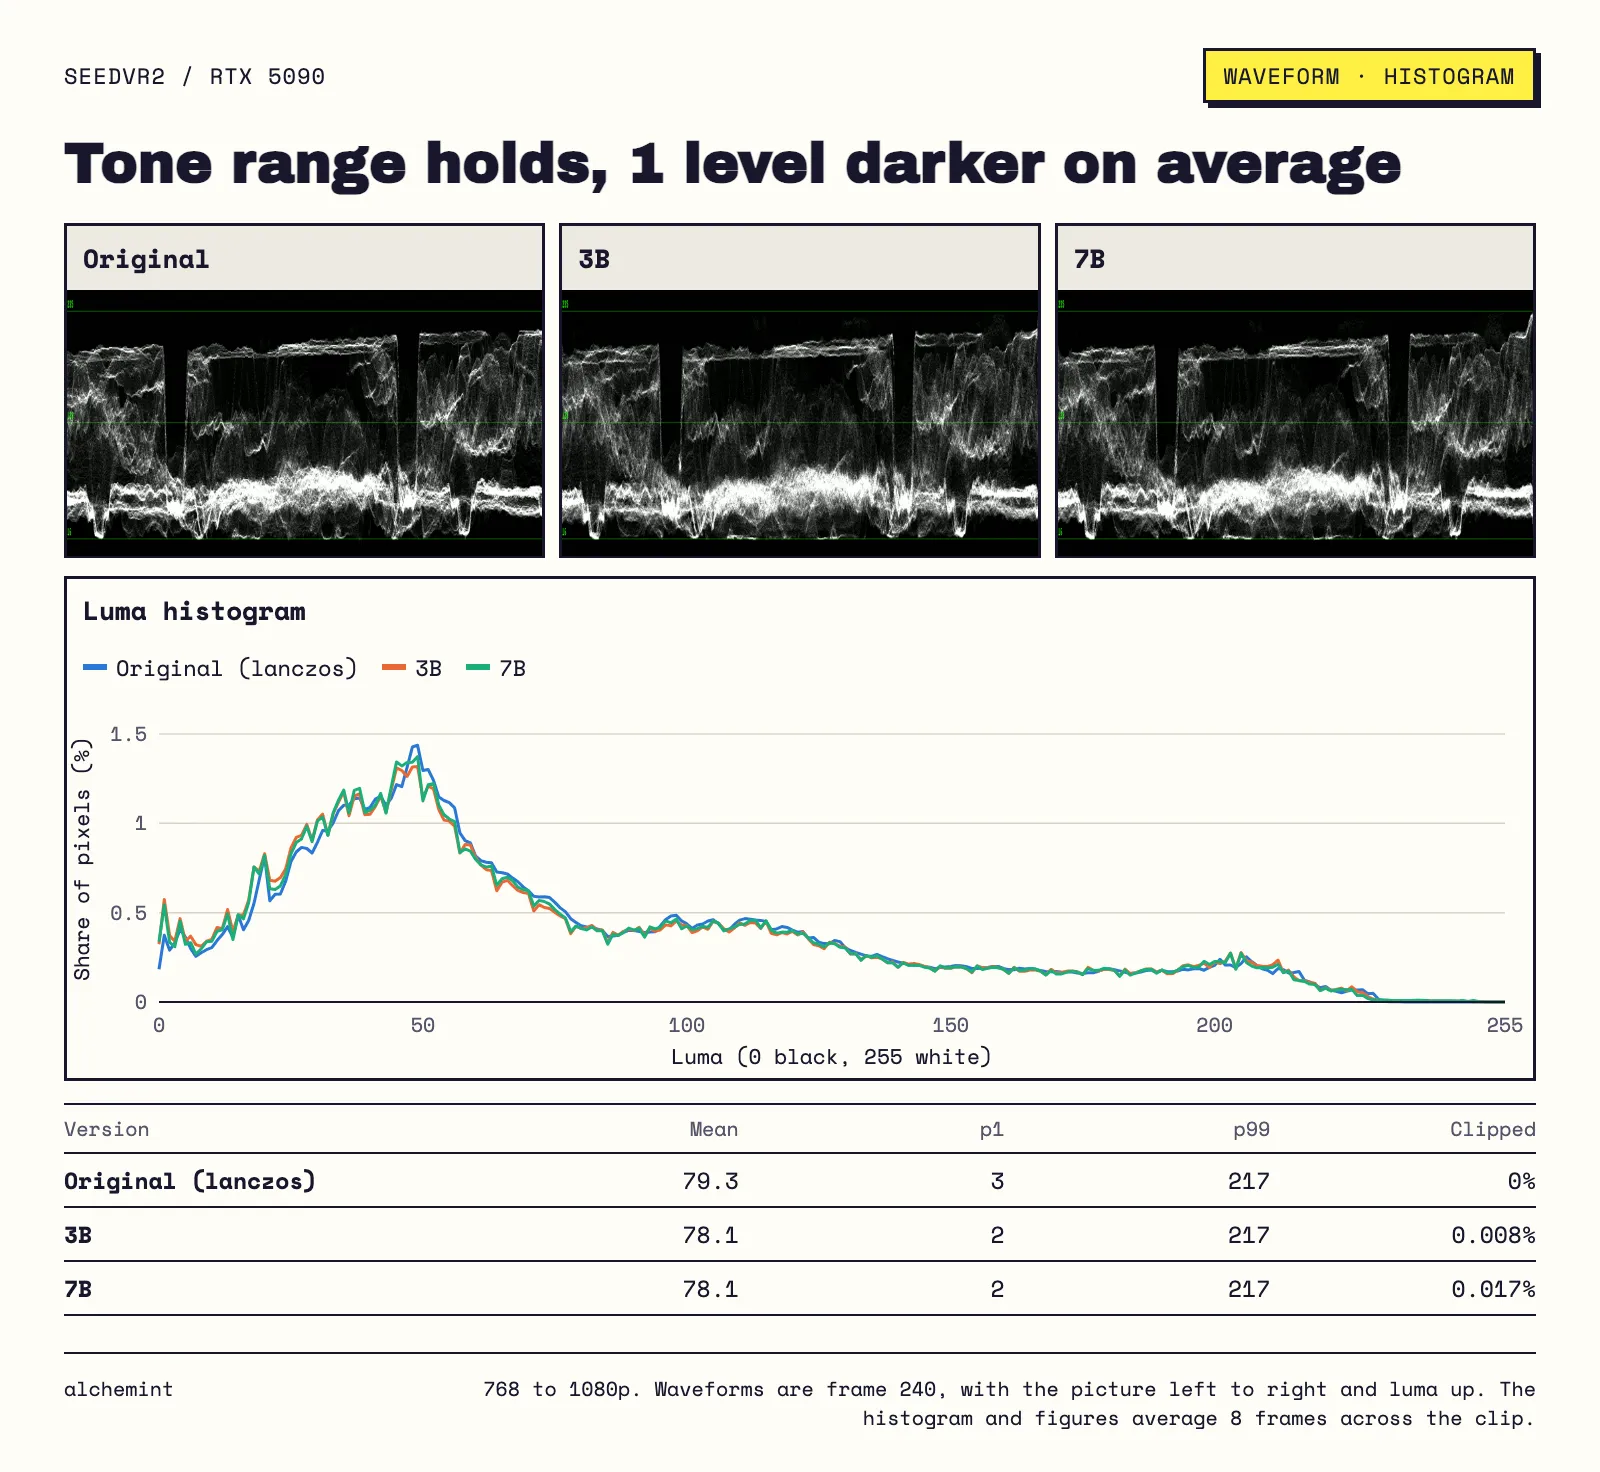
The tone range itself holds. Mean luma drops about 1 level, the 99th percentile moves 1 level at most, and clipping tops out at 0.017%.
Single frames pass. But nobody watches video one frame at a time.
Does upscaled video flicker?
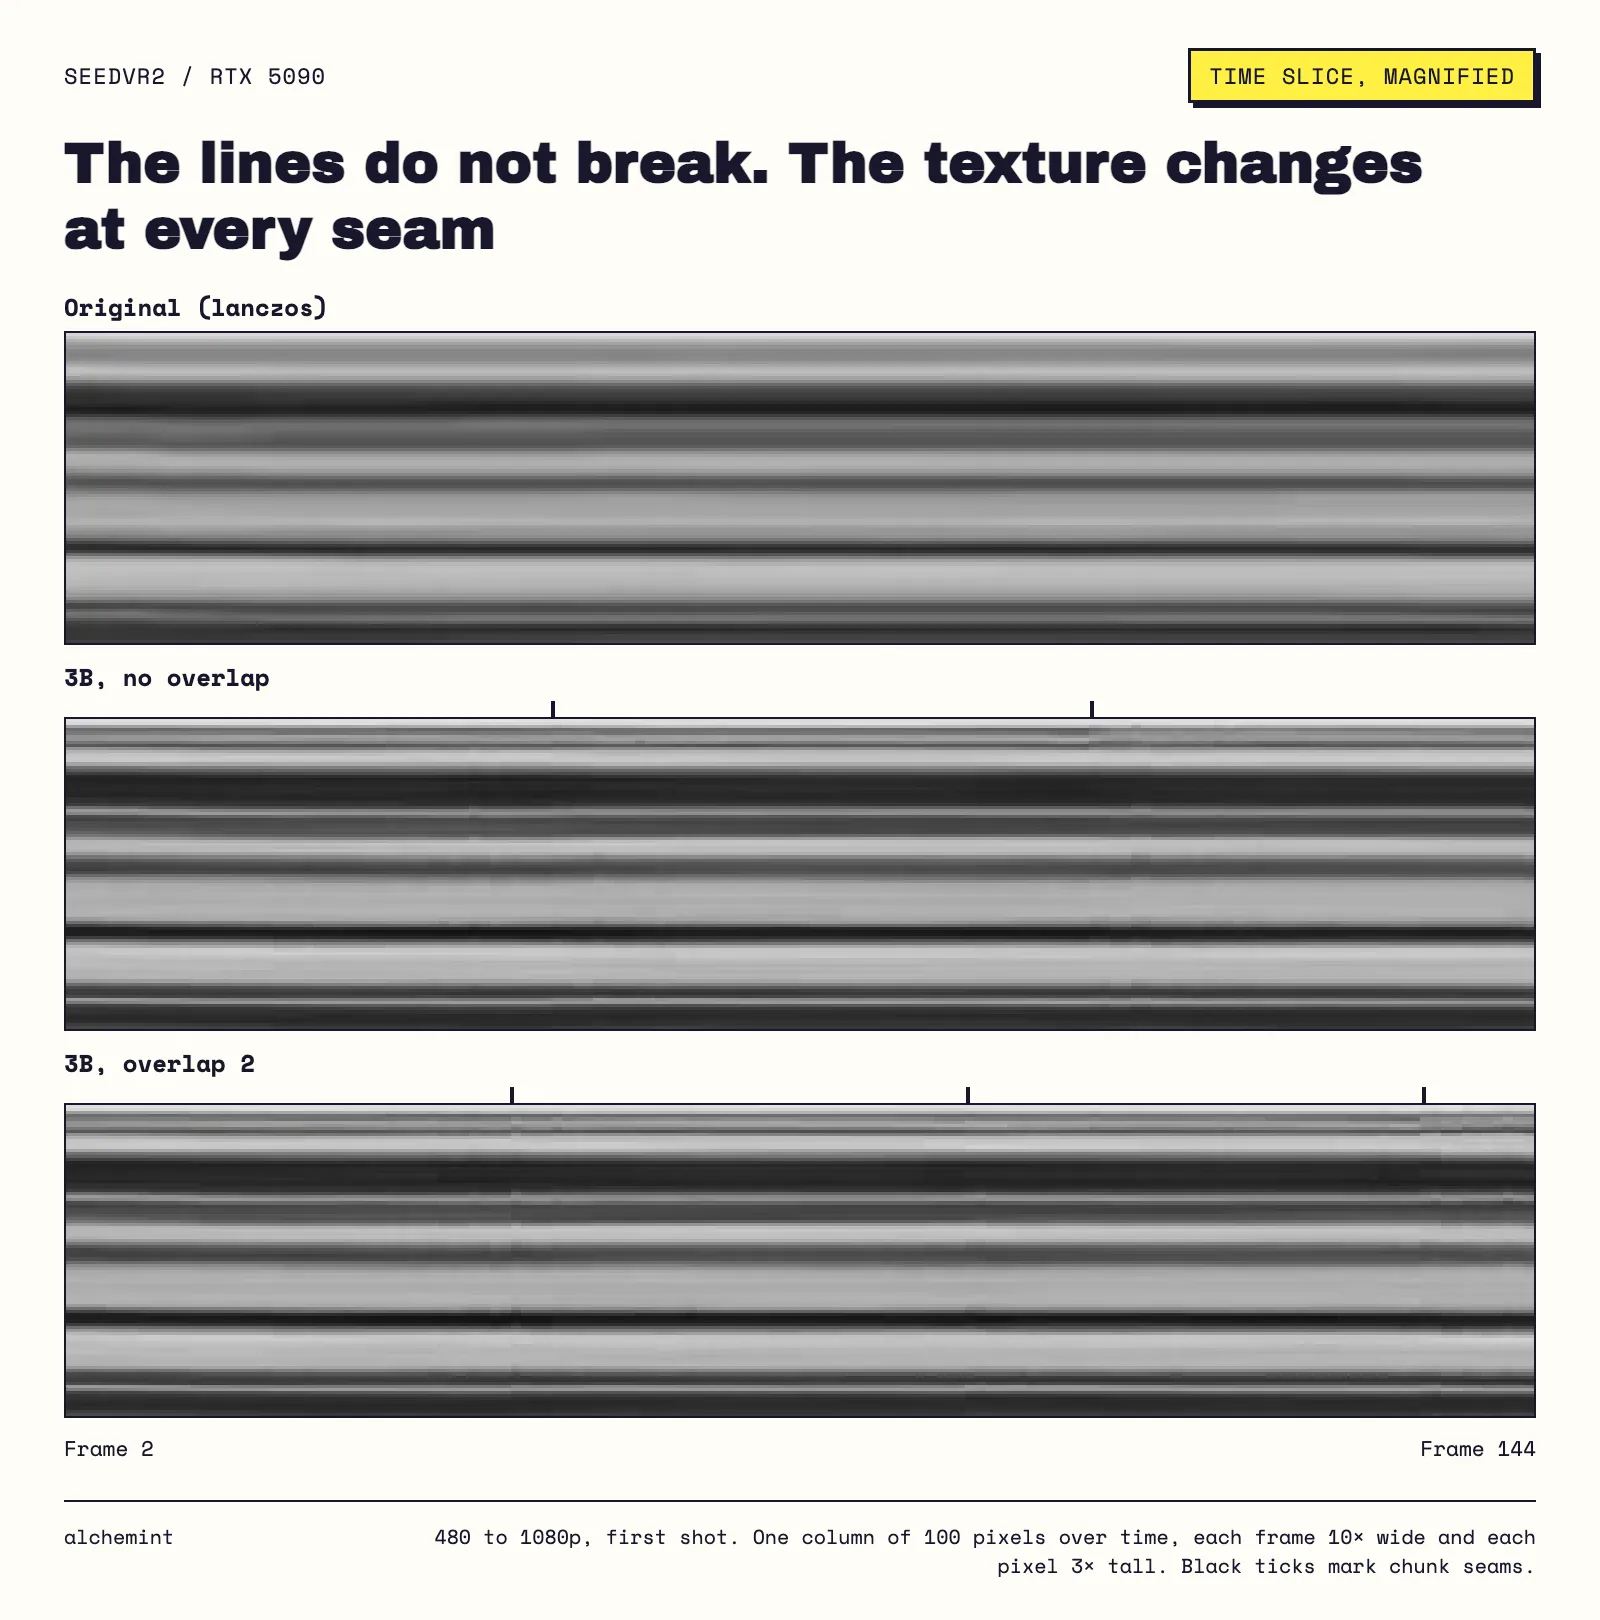
The model works chunk by chunk, about 2 seconds each in our setup. Chunks leave seams.
Lay one column of pixels out over time. The lines don't break, but the texture changes at every seam. The source has nothing like it.
In numbers: still areas of the source change 0.13 levels per frame, 3B changes 0.37 and 7B changes 0.30. That's 2 to 3 times as much, and still tiny. In the three frames from a seam it doubles again, to 0.56 for 3B and 0.50 for 7B.
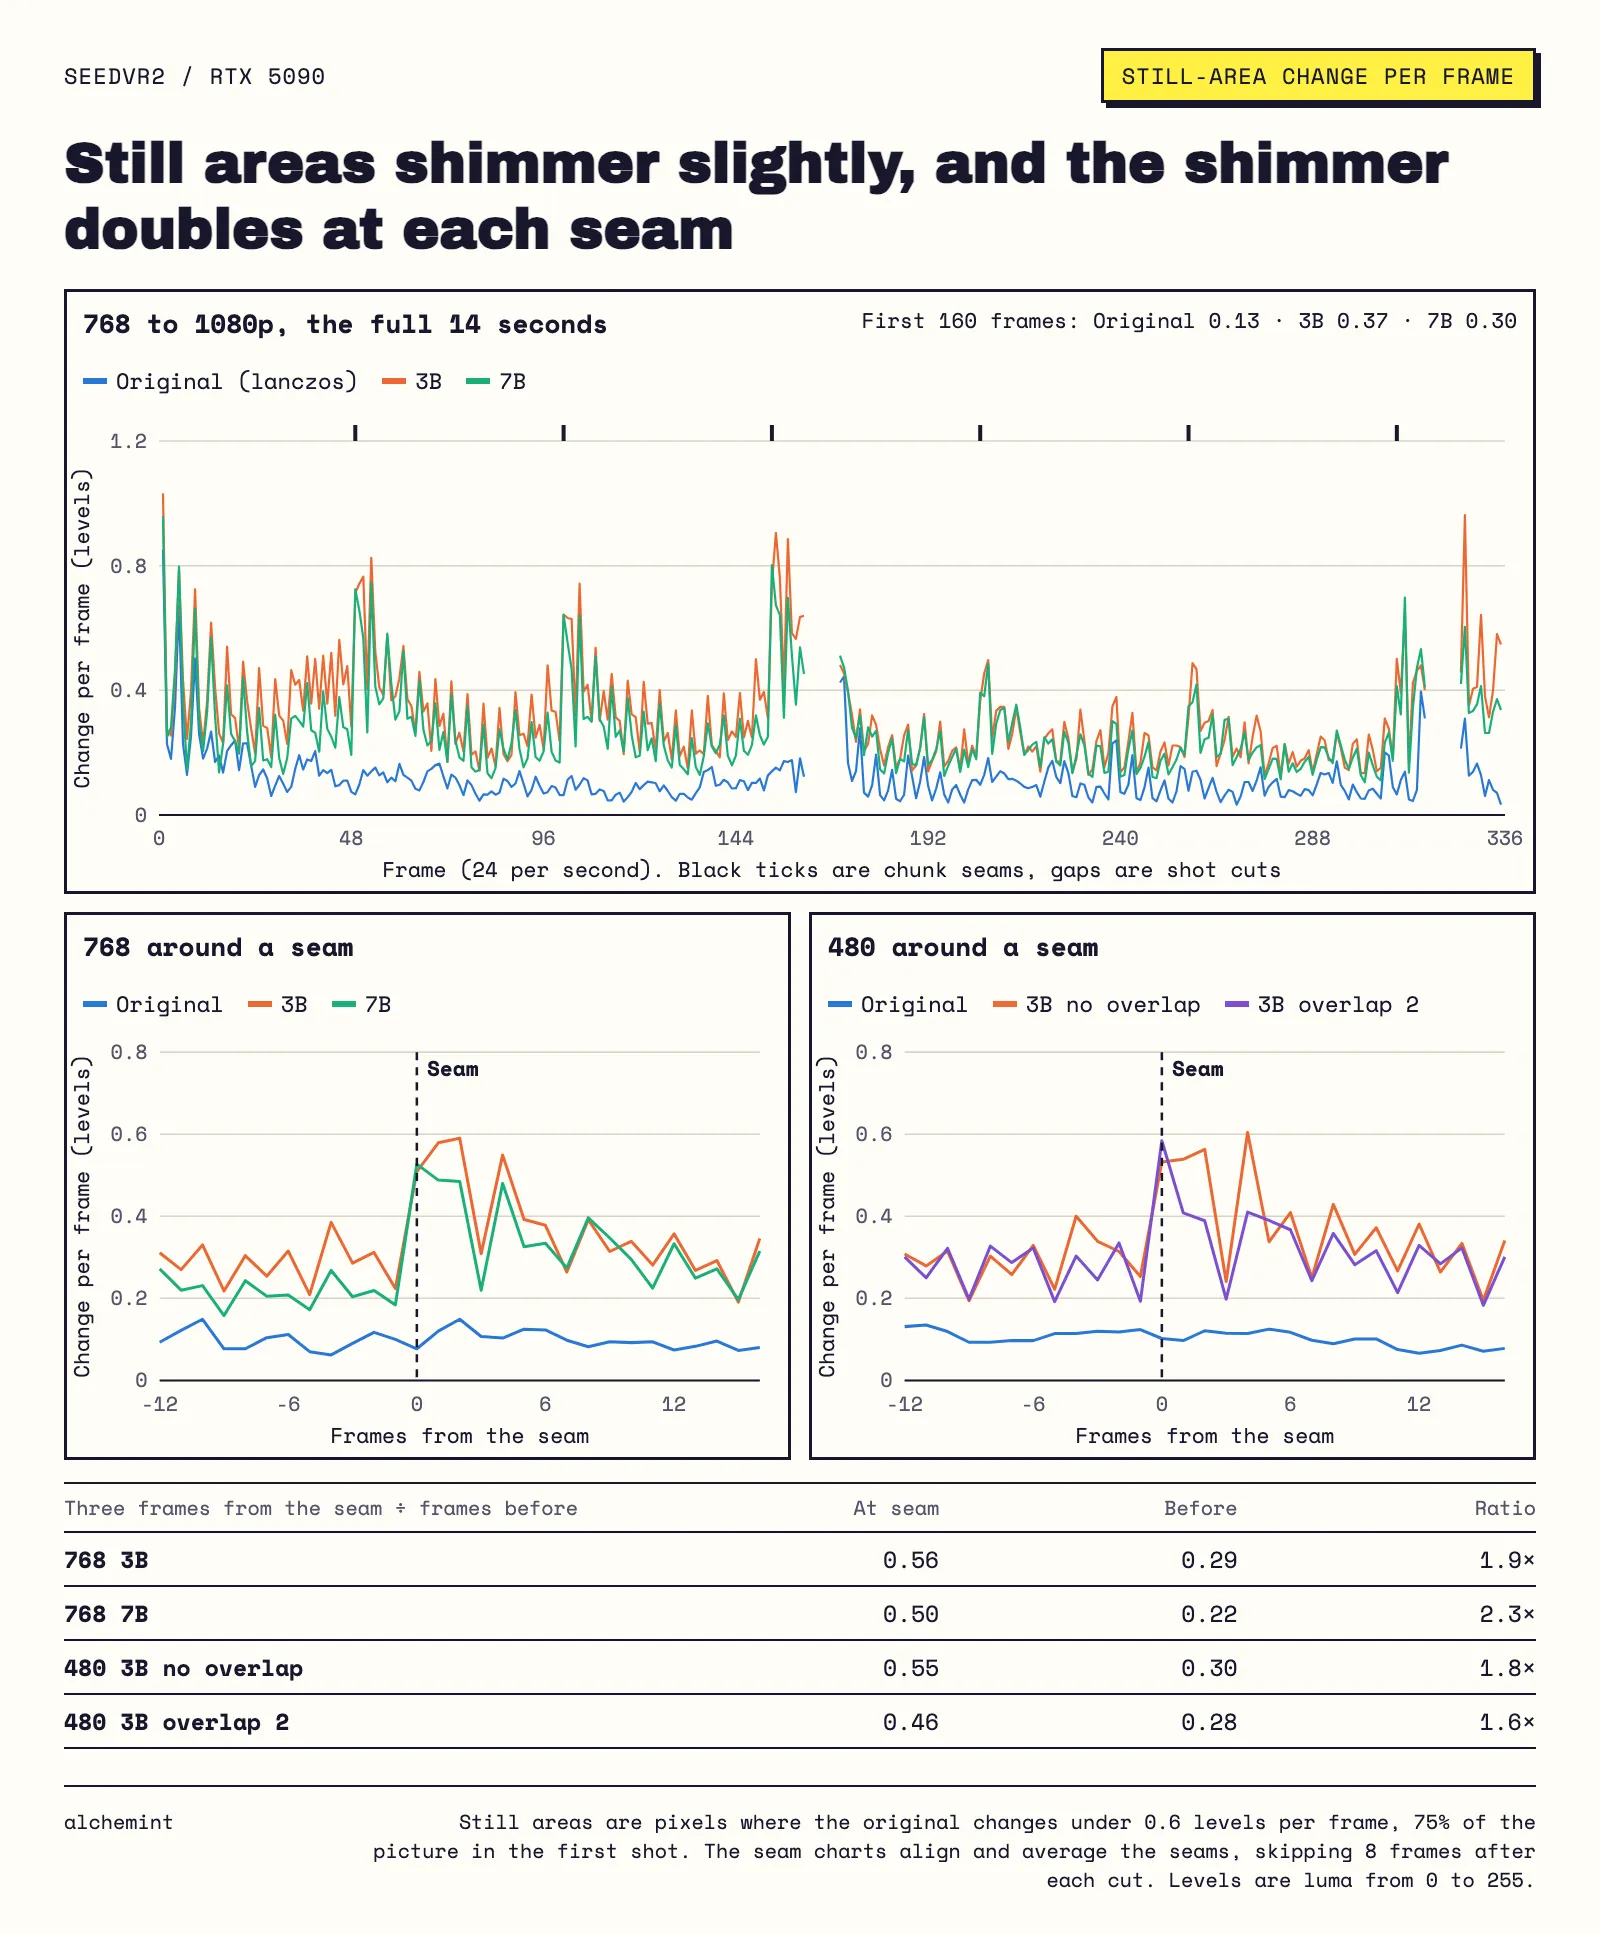
Overlap 2 helps a little: from 0.55 to 0.46 on the 480 clip, for about 8 more seconds across the clip. We leave it on.
Brightness is stable. What about color?
Does color shift?
With no correction, saturation goes up 13%. lab stays within 1.5%. Neither gets worse over the clip.
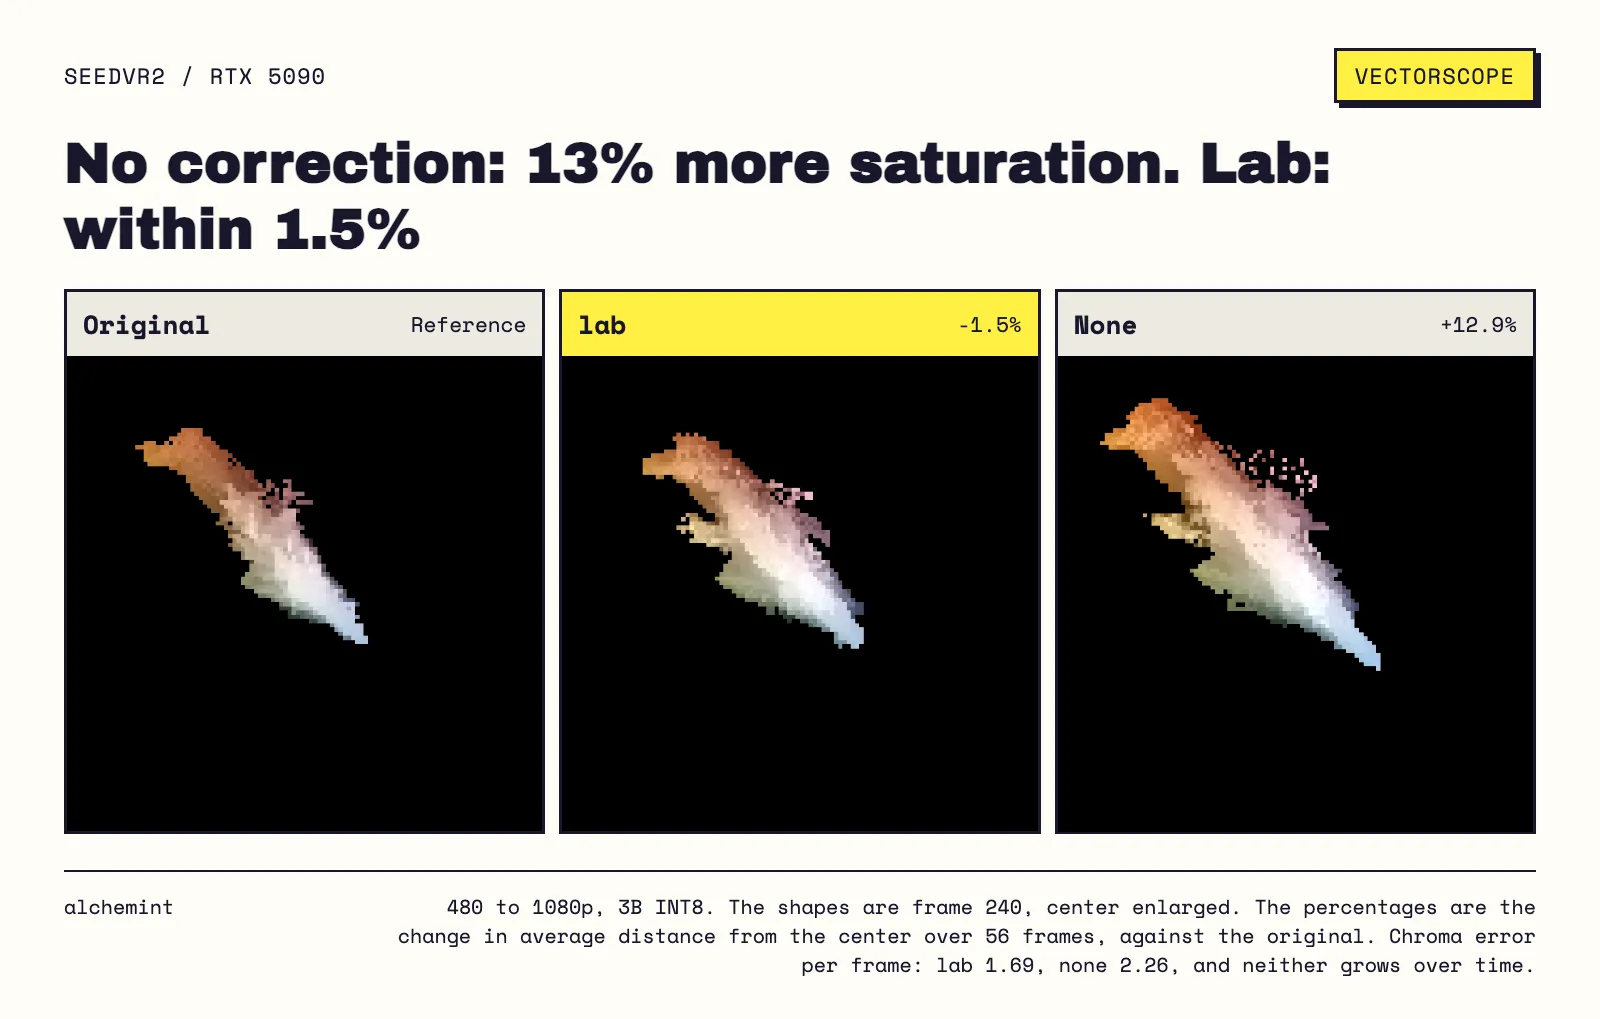
lab adds about 14 seconds on a 14-second clip. The ComfyUI template ships with none, so change it.
Two choices left: precision and source.
Which precision should you use?
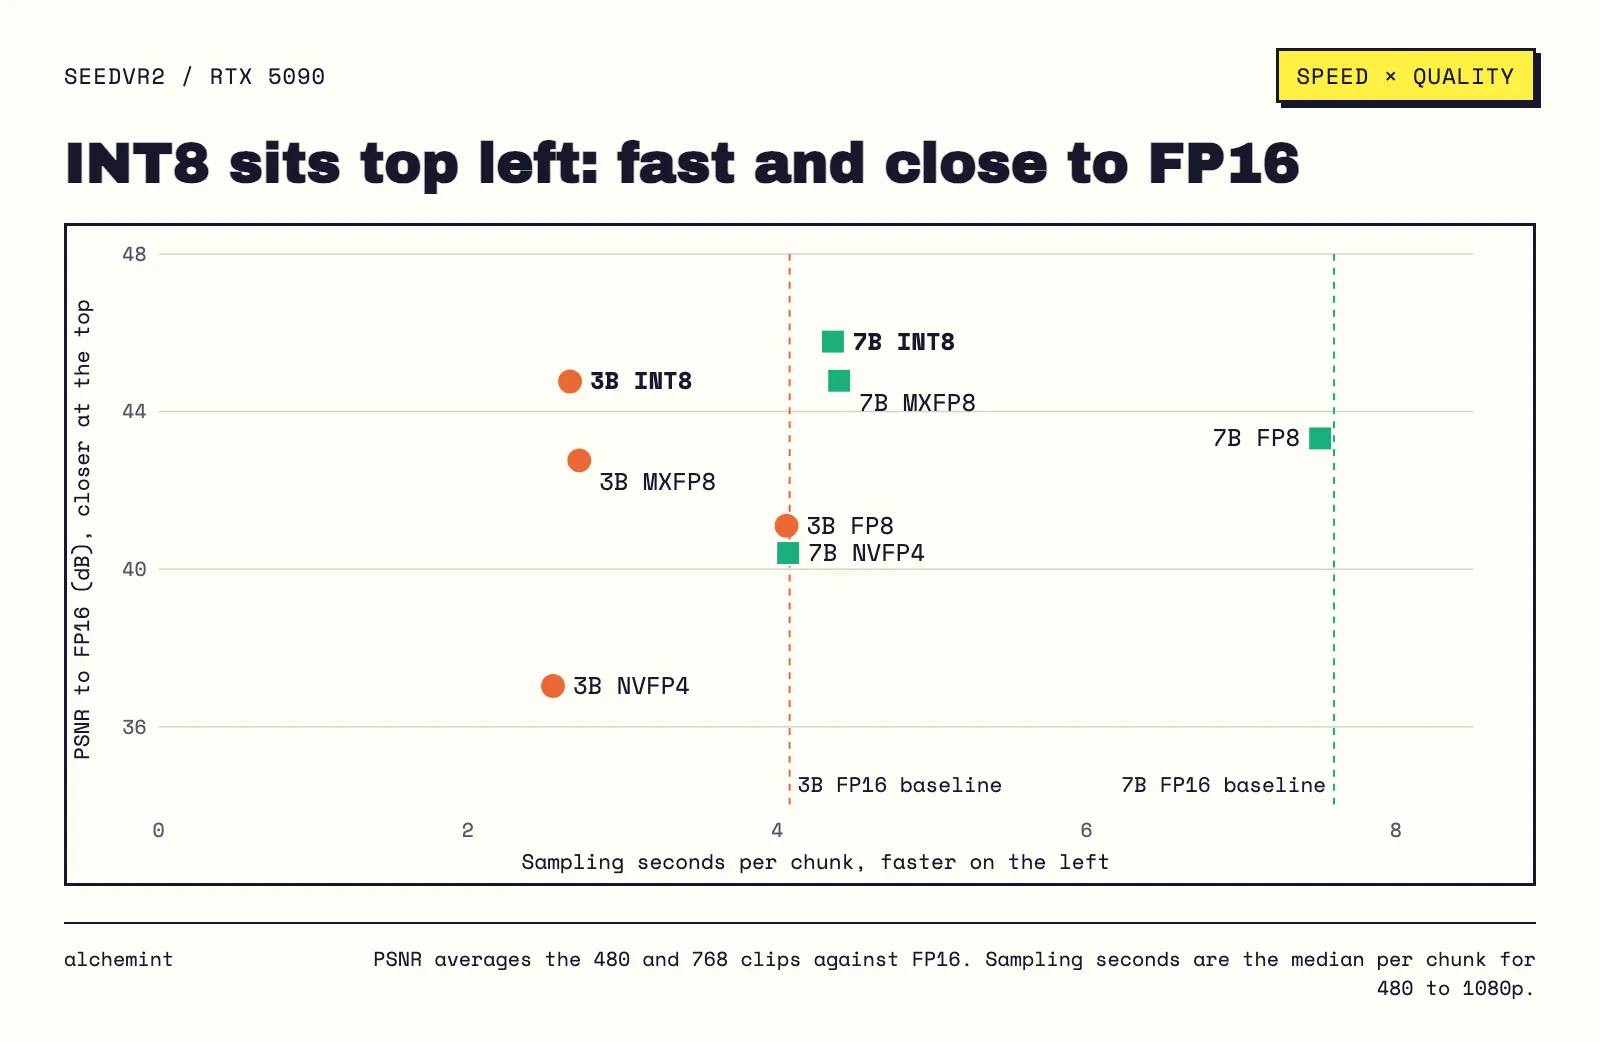
INT8. For both models it sits top left: fast, and about 45 dB PSNR against FP16. NVFP4 is the fastest and only reaches 37 to 40 dB.
Precision only touches sampling, not the VAE. From 768 to 1080p, fastest and slowest differ by 19 seconds with 3B and 49 with 7B.
Should you start from 480 or 768?
- Time is about the same. The 480 output has more energy outside the box, and it also grows wrinkles behind the ear that the source doesn't have. The 768 output is much cleaner.

The less the source gives it, the more the model guesses.
The settings we use
"Not bad" has numbers now.
| Setting | Choice |
|---|---|
| Model | 7B (3B for more sharpness, and more made-up detail) |
| Precision | INT8 |
| Target | 1080p (2K for more detail) |
| Color correction | lab |
| Chunk overlap | 2 |
| VAE tile | 768 is 11% faster than 512. 1024 ran out of VRAM on a 32 GB card |
How we tested
- Two 14-second clips generated with Pika H3 Flex, 832×480 and 1344×768, at 24 fps and 336 frames. They are separate takes of one scene, so each is compared only with its own original. Our H3 step comparison used the same scene in a separate test.
- RTX 5090 32GB, ComfyUI 0.35.0 built-in nodes, models repackaged by Comfy-Org, a fixed seed and H.264 at CRF 16, for 29 outputs.
- 2K ran only the first 7 seconds and 4K the first 3.5, with shorter chunks than 1080p, and only with 3B. Memory for 14 seconds at those sizes is an estimate.
- The 1080p runs measured 62 to 84 GiB of system RAM, and the table shows the lowest. Peak VRAM was about 19 to 25 GiB with INT8. That is not a minimum, and we did not test smaller cards.
- We did not test 7B with tile 768, or specifically test face close-ups, subtitles or large motion.